Code
data <- read_excel("../data/results_survey.xlsx")
data <- data[1:121] %>%
  filter(.[[18]] !='Yes') # not analysed any EEG method
register_gfont("Lato")
[1] TRUEHere we analyse how participants named presented figures and what kind of struggles their experienced. Also, their feedback on some issues presented
data <- read_excel("../data/results_survey.xlsx")
data <- data[1:121] %>%
filter(.[[18]] !='Yes') # not analysed any EEG method
register_gfont("Lato")[1] TRUEword_preproc <- function(data, N){
# N = 69
stop_list = c("a", "an", "the", "wise", "like", "s", "plot", "plots")
tmp <- data %>% filter(!is.na(.[[N]])) %>% select(., N) %>%
dplyr::rename(words = !!names(.)[1]) %>% mutate(words = tolower(words)) %>%
mutate(words_prep = str_split(words, "\\s+")) %>%
mutate(words_prep = sapply(words_prep, function(x) paste(x[!x %in% stop_list], collapse = " "))) %>%
mutate(words_prep = stri_replace_all_regex(words_prep,
pattern=c(" \\(.*", ", or.*", " across.*", " with.*", " at.*", " by.*", " over.*", #" of.*",
" for.*", " per.*", " across.*", " accross.*", " between.*"),
replacement=c(''),
vectorize=FALSE)) %>%
mutate(words_prep = str_split(words_prep, "\\s+")) %>%
mutate(words_prep = sapply(words_prep, function(x) paste(x[!x %in% stop_list], collapse = " ")))
return(tmp)
}dm <- data.frame()
data.frame(plots = c("ERP plot", "Butterfly plot", "Topoplot", "Topoplot timeseries", "ERP grid", "ERP image", "Channel image", "Parallel plot"),
time = c("x", "x", "", "(x)", "x", "x", "x", "x"),
channels = c("", "x", "x", "x", "x", "", "x", "x"),
spatial = c("", "", "x", "x", "x", "", "", ""),
conditions = c("x", "", "", "", "", "", "", "x"),
trials = c("", "x", "", "", "", "x", "", "")) %>% kable(align="lcccccc") %>%
kable_minimal(full_width = F, html_font = "Source Sans Pro") | plots | time | channels | spatial | conditions | trials |
|---|---|---|---|---|---|
| ERP plot | x | x | |||
| Butterfly plot | x | x | x | ||
| Topoplot | x | x | |||
| Topoplot timeseries | (x) | x | x | ||
| ERP grid | x | x | x | ||
| ERP image | x | x | |||
| Channel image | x | x | |||
| Parallel plot | x | x | x |
dim <- dplyr::tibble(
  Plots = c("../miniatures/1.png", "../miniatures/2.png", "../miniatures/3.png", "../miniatures/4.png", "../miniatures/5.png", "../miniatures/6.png", "../miniatures/7.png", "../miniatures/8.png"),
  Name = c("ERP plot", "Butterfly plot", "Topoplot", "Topoplot timeseries", "ERP grid", "ERP image", "Channel image", "Parallel plot"),
  Time = c("x", "x", "", "(x)", "x", "x", "x", "(x)"),
  Channels = c("", "x", "x", "x", "x", "", "x", "x"),
  Layout = c("", "", "x", "x", "x", "", "", ""),
  Conditions = c("x", "", "", "", "(x)", "", "", "x"),
  Trials = c("", "", "", "", "", "x", "", "(x)")
)

dim_plot <- dim %>%
  gt()  %>%
  cols_align(align = "center", columns = c(Time, Channels, Layout, Conditions, Trials)) %>%
  cols_width(
    Time ~ px(50),
    Channels ~ px(50),
    Layout ~ px(50),
    Conditions ~ px(50),
    Trials ~ px(50),
  ) %>%
  text_transform(
    locations = cells_body(columns = Plots),
    fn = function(x) {
      lapply(x, function(x) {
              html(paste(local_image(filename = x)))
      })
    }
  ) %>%  opt_table_font(font = "Source Sans Pro")  %>%
tab_options(data_row.padding = px(0.1), table.font.size = 14, container.padding.x = 1,  column_labels.border.bottom.color = "black",column_labels.border.top.color = "white",
    column_labels.border.top.width = px(3),) %>%
  tab_footnote(
  footnote = "x - full dimension, (x) - partial dimension",
  placement = "right"
)

dim_plot #%>% gtsave("Table 1.png")| Plots | Name | Time | Channels | Layout | Conditions | Trials |
|---|---|---|---|---|---|---|
 |
ERP plot | x | x | |||
 |
Butterfly plot | x | x | |||
 |
Topoplot | x | x | |||
 |
Topoplot timeseries | (x) | x | x | ||
 |
ERP grid | x | x | x | (x) | |
 |
ERP image | x | x | |||
 |
Channel image | x | x | |||
 |
Parallel plot | (x) | x | x | (x) | |
| x - full dimension, (x) - partial dimension | ||||||
n1 <- word_preproc(data, 69)  %>% #View()
   mutate(type = case_when(
      grepl("\\b(idea|sure|confus|aware|do not|know|why|remember)\\b", words) == TRUE ~ "bad",
      grepl("\\b(average(d)?|averagded)\\b.*\\b(erp(s)?|ep|related)\\b|\\b(erp(s)?|ep|related)\\b.*\\baverage(d)?\\b", words) == TRUE ~ "averaged erp (plot)",
      grepl("\\bwave(form|forms)?\\b.*\\b(erp(s)?|ep|related)\\b|\\b(erp(s)?|ep|related)\\b.*\\bwave(form|forms)?\\b", words) == TRUE ~ "erp wave(form)s",
      grepl("\\btime(course|series|domain)?\\b.*\\b(erp(s)?|ep|related)\\b|\\b(erp(s)?|ep|related)\\b.*\\btime(course|series|domain)?\\b", words) == TRUE ~ "erp timecourse/timeseries",
      grepl("\\b(classic(al)?)\\b", words) == TRUE ~ "classic erp",
      grepl("\\b(standard)\\b", words) == TRUE ~ "standart erp",
      grepl("\\b(evoked)\\b", words) == TRUE ~ "evoked potential/reponses",
      grepl("\\b(erp(s)?|ep|related)\\b", words) == TRUE ~ "erp (plot)",
      grepl("\\b(time|timeseries)\\b", words) == TRUE ~ "time series",

      grepl("\\b(line|boundedline)\\b", words) == TRUE ~ "line (plot)",
      grepl("\\b(single|singleplot|singe)\\b", words) == TRUE ~ "single (channel)",
      grepl("\\b(waveform(s)?)\\b", words) == TRUE ~ "waveform",
       grepl("\\b(p300)\\b", words) == TRUE ~ "p300",
      grepl("\\b(average|mean)\\b", words) == TRUE ~ "average/mean",
      grepl("\\b(amplitude)\\b", words) == TRUE ~ "amplitude",

      TRUE ~ '_other'
      ))  %>%  #View()
   filter(!is.na(type), type != "bad") %>% dplyr::select(type) %>%  table(.) %>%
  data.frame(.) %>% arrange(desc(Freq))  %>%
   rename_at(vars(colnames(.)), ~ c("ERP plot", "n"))
n1
ERP plot n
1 erp (plot) 77
2 averaged erp (plot) 38
3 erp wave(form)s 12
4 evoked potential/reponses 12
5 _other 11
6 erp timecourse/timeseries 11
7 time series 7
8 average/mean 6
9 line (plot) 5
10 single (channel) 5
11 amplitude 3
12 standart erp 3
13 waveform 3
14 classic erp 2
15 p300 2n1 %>%
mutate(total = sum(n)) %>% slice(1:11) %>%
mutate(p = round(as.numeric(n)/as.numeric(total), 2) * 100) ERP plot n total p
1 erp (plot) 77 197 39
2 averaged erp (plot) 38 197 19
3 erp wave(form)s 12 197 6
4 evoked potential/reponses 12 197 6
5 _other 11 197 6
6 erp timecourse/timeseries 11 197 6
7 time series 7 197 4
8 average/mean 6 197 3
9 line (plot) 5 197 3
10 single (channel) 5 197 3
11 amplitude 3 197 2n2 <- word_preproc(data, 80) %>%
mutate(type = case_when(
grepl("\\b(idea|sure|confus|aware|do not|know|why|remember|unsure|confusing|mess)\\b", words) == TRUE ~ "bad",
grepl("\\b(butterfly|bitterfly|buterfly|buttefly)\\b", words) == TRUE ~ "butterfly (plot)",
grepl("\\b(spaghetti)\\b", words) == TRUE ~ "spaghetti",
grepl("\\b(time|timeseries|timecourse)\\b", words) == TRUE ~ "time series",
grepl("\\b(channel|single|singleplot|individual)\\b", words) == TRUE ~ "single/individual channel erp (plot)",
grepl("\\b(channels|multichannel|multeple|multiple|multi|all|muti|electrodes)\\b", words) == TRUE ~ "multi(channel/electrode) erp (plot)",
grepl("\\b(evoked)\\b", words) == TRUE ~ "evoked responces",
grepl("\\b(erp(s)?|eprs|event-related)\\b", words) == TRUE ~ "erp (plot)",
TRUE ~ '_other'
)) %>% #View()
filter(!is.na(type), type != "bad") %>%
dplyr::select(type) %>% table(.) %>%
data.frame(.) %>% arrange(desc(Freq)) %>%
rename_at(vars(colnames(.)), ~ c("Butterfly plot", "n"))
n2 Butterfly plot n
1 butterfly (plot) 76
2 single/individual channel erp (plot) 27
3 multi(channel/electrode) erp (plot) 23
4 time series 13
5 erp (plot) 9
6 _other 8
7 spaghetti 2
8 evoked responces 1n3 <- word_preproc(data, 85) %>%
mutate(type = case_when(
grepl("\\b(idea|sure|confus|aware|do not|know|why|remember|unsure|confusing|mess)\\b", words) == TRUE ~ "bad",
grepl("\\b(topo|topoplot(s)?)\\b", words) == TRUE ~ "topo(plot)",
grepl("\\b(topomap|topomape)\\b", words) == TRUE ~ "topomap",
grepl("\\b(topograph(y|ic|ical|ies)|topgraphy|topograbphy)\\b", words) == TRUE ~ "topography (plot)",
grepl("\\b(heat(map)?)\\b", words) == TRUE ~ "heatmap",
grepl("\\b(map)\\b", words) == TRUE ~ "scalp map",
grepl("\\b(distribution)\\b", words) == TRUE ~ "scalp distribution",
TRUE ~ '_other'
)) %>% #View()
dplyr::select(type) %>% table(.) %>%
data.frame(.) %>% arrange(desc(Freq)) %>%
rename_at(vars(colnames(.)), ~ c("Topoplot", "n"))
n3 Topoplot n
1 topo(plot) 76
2 topography (plot) 74
3 topomap 14
4 _other 10
5 scalp map 8
6 heatmap 5
7 scalp distribution 5n4 <- word_preproc(data, 90) %>%
mutate(type = case_when(
grepl("\\b(idea|sure|confus|aware|do not|know|why|remember|unsure|confusing|mess|unclear)\\b", words) == TRUE ~ "bad",
grepl("\\btopograph(y|ic|ical|ies)?\\b.*\\btime\\b|\\btime\\b.*\\btopograph(y|ic|ical|ies)?\\b", words) == TRUE ~ "topography over time(series/course)",
grepl("\\btopo(plot|plots)?\\b.*\\btime(course|series|line)?\\b|\\btime(course|series|line)?\\b.*\\btopo(plot|plots)?|topology\\b", words) == TRUE ~ "topo(plot) over time(series/course)",
grepl("\\btopo(plot|plots)?\\b.*\\btime(s)?\\b|\\btime(s)?\\b.*\\btopo(plot|plots)?|topology\\b", words) == TRUE ~ "topo(plot) over time(series/course)",
grepl("\\btopo(plot|plots)?\\b.*\\bseries\\b|\\bseries\\b.*\\btopo(plot|plots)?\\b", words) == TRUE ~ "topo series",
grepl("\\b(topo(s)?|topoplot(s)?)\\b", words) == TRUE ~ "topo(plot)",
grepl("\\b(topomap(s|e)?)\\b", words) == TRUE ~ "topomap",
grepl("\\btopograph(y|ic|ical|ies)\\b.*\\bmap(s)?\\b|\\bmap(s)?\\b.*\\btopograph(y|ic|ical|ies)\\b", words) == TRUE ~ "topographical map (over time)",
grepl("\\b(topograph(y|ic|ical|ies)?|topgraphy|topograhy|topograbphy|topgraphies)\\b", words) == TRUE ~ "topography",
grepl("\\b(heat(map)?)\\b", words) == TRUE ~ "heatmap",
grepl("\\b(map(s)?)\\b", words) == TRUE ~ "scalp map (over time)",
grepl("\\bscalp\\b.*\\bplot(s)?\\b|\\bplot(s)?\\b.*\\bscalp\\b", words) == TRUE ~ "scalp plot",
grepl("\\b(distribution)\\b", words) == TRUE ~ "scalp distribution",
TRUE ~ '_other'
)) %>%
mutate(type = ifelse(nchar(words) == 1, "bad", type)) %>%
#View()
dplyr::select(type) %>% table(.) %>%
data.frame(.) %>% arrange(desc(Freq)) %>% filter(type != "bad") %>%
rename_at(vars(colnames(.)), ~ c("Topoplot\ntimeseries", "n"))
n4 Topoplot\ntimeseries n
1 topo(plot) over time(series/course) 44
2 topography over time(series/course) 42
3 topo(plot) 23
4 topography 21
5 topomap 14
6 _other 11
7 scalp map (over time) 9
8 topo series 9
9 topographical map (over time) 6
10 heatmap 4
11 scalp distribution 3
12 scalp plot 3n5 <- word_preproc(data, 97) %>%
mutate(type = case_when(
grepl("\\b(idea|sure|confus|aware|do not|know|why|remember|unsure|confusing|mess|unclear|ugly|don't|useless)\\b", words) == TRUE ~ "bad",
grepl("\\bwave(form|forms)?\\b.*\\b(erp(s)?|ep|related)\\b|\\b(erp(s)?|ep|related)\\b.*\\bwave(form|forms)?\\b", words) == TRUE ~ "erp wave(form)s",
grepl("\\b(multi(plot|channel|ploter|ploterp)?)\\b", words) == TRUE ~ "multi(channel) plot",
grepl("\\bchannel(s)?\\b.*\\berp(s)?\\b|\\berp(s)?\\b.*\\bchannel(s)?\\b", words) == TRUE ~ "erp over channels",
grepl("\\btopograph(y|ic|ical|ies|logy)|topology\\b.*\\berp(s)\\b|\\berp(s)\\b.*\\btopograph(y|ic|ical|ies|logy)|topology\\b", words) == TRUE ~ "topographic erp",
grepl("\\b(scalp)\\b", words) == TRUE ~ "(erp) scalp",
grepl("\\b(array)\\b", words) == TRUE ~ "(erp) array",
grepl("\\btopo(plot|plots)?\\b.*\\berp(s)?\\b|\\berp(s)?\\b.*\\btopo(plot|plots)?\\b", words) == TRUE ~ "topo erp",
grepl("\\b(erp(s)?|eprs|event-related)\\b", words) == TRUE ~ "erp",
grepl("\\b(topo(s)?|topoplot(s)?|toposplot)\\b", words) == TRUE ~ "topo",
grepl("\\b(channel(s|plot)?)\\b", words) == TRUE ~ "channel (plot)",
TRUE ~ '_other'
)) %>%
mutate(type = ifelse(nchar(words) == 1, "bad", type)) %>%
mutate(type = ifelse(grepl("topographic erp", type) & !grepl("\\berp(s)?|evoked|eeg\\b", words), "topographical plot(s)", type)) %>%
# View()
dplyr::select(type) %>% table(.) %>%
data.frame(.) %>% arrange(desc(Freq)) %>% filter(type != "bad") %>%
rename_at(vars(colnames(.)), ~ c("ERP grid", "n"))
n5 ERP grid n
1 erp over channels 24
2 multi(channel) plot 23
3 topographic erp 23
4 (erp) scalp 21
5 erp 21
6 _other 11
7 channel (plot) 9
8 topographical plot(s) 8
9 erp wave(form)s 6
10 topo 6
11 topo erp 6
12 (erp) array 4# write.csv(n5, "topogrid.csv")n6 <- word_preproc(data, 102) %>% #View()
mutate(type = case_when(
grepl("\\b(idea|sure|confus|aware|do not|know|why|good|remember|unsure|confusing|mess|\\?\\?|unclear|ugly|don't|useless)\\b", words) == TRUE ~ "bad",
grepl("\\b(sort(ed)?)\\b", words) == TRUE ~ "sorted erp trials",
grepl("\\bimage\\b.*\\berp(s)?\\b|\\berp(s)?\\b.*\\bimage|erpimage|image\\b", words) == TRUE ~ "erp image",
grepl("\\bimage\\b.*\\bepoch(s)?\\b|\\bepoch(s)?\\b.*\\bimage\\b", words) == TRUE ~ "epoch image",
grepl("\\berp(s)?\\b.*\\btrial(s)?\\b|\\btrial(s)?\\b.*\\berp(s)?\\b", words) == TRUE ~ "erp trials",
grepl("\\b(raster(plot)?)\\b", words) == TRUE ~ "raster",
grepl("\\b(waterfall)\\b", words) == TRUE ~ "waterfall",
grepl("\\b(heat(map)?)\\b", words) == TRUE ~ "heatmap",
grepl("\\b(erp(s)?|eprs|ersp|event-related)\\b", words) == TRUE ~ "erp",
grepl("\\b(voltage)\\b", words) == TRUE ~ "voltage (over trial)",
grepl("\\b(time(series)?|serie(s)?)\\b", words) == TRUE ~ "time series/frequencies",
grepl("\\b(frequency|frecuencia)\\b", words) == TRUE ~ "time series/frequencies",
grepl("\\b(trial(s|wise)?|trialplot)\\b", words) == TRUE ~ "trials",
grepl("\\b(spectrum|spectral)\\b", words) == TRUE ~ "spectral",
TRUE ~ '_other'
)) %>%
mutate(type = ifelse(nchar(words) == 1, "bad", type)) %>% # View()
dplyr::select(type) %>% table(.) %>%
data.frame(.) %>% arrange(desc(Freq)) %>% filter(type != "bad") %>%
rename_at(vars(colnames(.)), ~ c("ERP image", "n"))
n6 ERP image n
1 erp image 31
2 sorted erp trials 22
3 trials 13
4 erp trials 11
5 time series/frequencies 11
6 _other 5
7 heatmap 5
8 voltage (over trial) 5
9 raster 4
10 erp 3
11 spectral 2
12 waterfall 2#write.csv(n6, "erpimage.csv")n7 <- word_preproc(data, 107) %>% #View()
mutate(type = case_when(
grepl("\\b(idea|sure|confus|aware|do not|know|why|good|remember|unsure|confusing|mess|\\?\\?|unclear|-|ugly|don't|x|useless)\\b", words) == TRUE ~ "bad",
grepl("\\b(amplitude(s)?)\\b", words) == TRUE ~ "(erp) amplitudes",
grepl("\\b(parallel)\\b", words) == TRUE ~ "parallel coordinates",
TRUE ~ '_other'
)) %>% #View()
dplyr::select(type) %>% table(.) %>%
data.frame(.) %>% arrange(desc(Freq)) %>% filter(type != "bad") %>%
rename_at(vars(colnames(.)), ~ c("Parallel plot", "n"))
n7 Parallel plot n
1 (erp) amplitudes 4
2 parallel coordinates 4n8 <- word_preproc(data, 112) %>%
mutate(type = case_when(
grepl("\\b(idea|sure|confus|aware|do not|know|why|good|remember|unsure|confusing|mess|normal|\\?\\?|unclear|recall|ugly|don't|useless|nan|clear)\\b", words) == TRUE ~ "bad",
grepl("\\bimage\\b.*\\bchannel\\b|\\bchannel\\b.*\\bimage|chanimage|imagesc\\b", words) == TRUE ~ "channel image",
grepl("\\bimage\\b.*\\berp(s)?\\b|\\berp(s)?\\b.*\\bimage|erpimage\\b", words) == TRUE ~ "erp image",
grepl("\\b(heat(map)?)\\b", words) == TRUE ~ "heatmap",
grepl("\\b(image)\\b", words) == TRUE ~ "image",
grepl("\\b(raster(plot)?|custer)\\b", words) == TRUE ~ "raster (plot)",
grepl("\\b(matrix)\\b", words) == TRUE ~ "(erp) matrix",
grepl("\\b(channel(s|wise)?)\\b", words) == TRUE ~ "channel(s) (erp)",
grepl("\\b(erp(s)?|eprs|ersp|event-related)\\b", words) == TRUE ~ "erp",
grepl("\\b(voltage)\\b", words) == TRUE ~ "voltage",
TRUE ~ '_other'
)) %>%
mutate(type = ifelse(nchar(words) == 1, "bad", type)) %>% #View()
dplyr::select(type) %>% table(.) %>%
data.frame(.) %>% arrange(desc(Freq)) %>% filter(type != "bad") %>%
rename_at(vars(colnames(.)), ~ c("Channel_image", "n"))
n8 Channel_image n
1 channel(s) (erp) 34
2 heatmap 15
3 channel image 9
4 _other 8
5 erp image 8
6 image 6
7 (erp) matrix 5
8 raster (plot) 5
9 erp 3
10 voltage 3write.xlsx(n1 %>%
rename_at(vars(colnames(.)), ~ c("Plot names", "Scores")), "../data/aggregated_plotnames.xlsx", sheetName
="ERP plot", row.names=FALSE)
write.xlsx(n2 %>%
rename_at(vars(colnames(.)), ~ c("Plot names", "Scores")), "../data/aggregated_plotnames.xlsx", append=TRUE, sheetName ="Butterfly plot", row.names=FALSE)
write.xlsx(n3 %>%
rename_at(vars(colnames(.)), ~ c("Plot names", "Scores")), "../data/aggregated_plotnames.xlsx", append=TRUE, sheetName ="Topoplot", row.names=FALSE)
write.xlsx(n4 %>%
rename_at(vars(colnames(.)), ~ c("Plot names", "Scores")), "../data/aggregated_plotnames.xlsx", append=TRUE, sheetName ="Topoplot timeseries", row.names=FALSE)
write.xlsx(n5 %>%
rename_at(vars(colnames(.)), ~ c("Plot names", "Scores")), "../data/aggregated_plotnames.xlsx", append=TRUE, sheetName ="ERP grid", row.names=FALSE)
write.xlsx(n6 %>%
rename_at(vars(colnames(.)), ~ c("Plot names", "Scores")), "../data/aggregated_plotnames.xlsx", append=TRUE, sheetName ="ERP image", row.names=FALSE)
write.xlsx(n8 %>%
rename_at(vars(colnames(.)), ~ c("Plot names", "Scores")), "../data/aggregated_plotnames.xlsx", append=TRUE, sheetName ="Channel image", row.names=FALSE)
write.xlsx(n7 %>%
rename_at(vars(colnames(.)), ~ c("Plot names", "Scores")), "../data/aggregated_plotnames.xlsx", append=TRUE, sheetName ="Parallel plot", row.names=FALSE)plot_names <- c("ERP plot", "Butterfly plot", "Topoplot", "Topoplot\ntimeseries", "ERP grid", "ERP image", "Channel image", "Parallel plot")
t <- list(n1, n2, n3, n4, n5, n6, n8, n7)
create_table <- function(t){
tmp <- t[[1]] %>% mutate(total = sum(n)) %>% slice(1:3) %>% mutate(type = plot_names[1]) %>% rename_with(.cols = 1, ~"names") %>% relocate(type, names )
for (i in 2:8){
tmp <- t[[i]] %>% mutate(total = sum(n)) %>% slice(1:3) %>%
mutate(type = plot_names[i]) %>% rename_with(.cols = 1, ~"names") %>% relocate(type, names) %>%
rbind(tmp, .)
}
tmp <- tmp %>%
group_by( type) %>%
dplyr::mutate(groupRow = 1:n()) %>%
ungroup() %>% mutate(p = round(as.numeric(n)/as.numeric(total), 2) * 100) %>%
mutate(score = paste(p, total, sep = "% out of ")) %>%
dplyr::mutate(type = ifelse(groupRow == 1, as.character(type), "")) %>%
dplyr::mutate(score = ifelse(groupRow == 1, as.character(score), paste(p, "%", sep = ""))) %>%
select(-c(groupRow))
}
create_table(t) %>% data.frame() %>%
mutate(names = str_to_sentence(names)) %>%
mutate(names = str_replace(names, "Erp", "ERP")) %>%
mutate(names = str_replace(names, "erp", "ERP")) %>%
dplyr::rename(`Plot types` = type,
`Names given by respondents` = names,
`Scores` = score) %>% select(-n, -total, -p) %>% kable() %>%
kable_minimal(full_width = F, html_font = "Source Sans Pro") %>%
row_spec(c(3, 6, 9, 12, 15, 18, 21), extra_css = "border-bottom: 1px dotted gray;")| Plot types | Names given by respondents | Scores |
|---|---|---|
| ERP plot | ERP (plot) | 39% out of 197 |
| Averaged ERP (plot) | 19% | |
| ERP wave(form)s | 6% | |
| Butterfly plot | Butterfly (plot) | 48% out of 159 |
| Single/individual channel ERP (plot) | 17% | |
| Multi(channel/electrode) ERP (plot) | 14% | |
| Topoplot | Topo(plot) | 40% out of 192 |
| Topography (plot) | 39% | |
| Topomap | 7% | |
| Topoplot timeseries | |Topo(plot) over time(series/course) | |23% out of 189 |
| Topography over time(series/course) | 22% | |
| Topo(plot) | 12% | |
| ERP grid | ERP over channels | 15% out of 162 |
| Multi(channel) plot | 14% | |
| Topographic ERP | 14% | |
| ERP image | ERP image | 27% out of 114 |
| Sorted ERP trials | 19% | |
| Trials | 11% | |
| Channel image | Channel(s) (ERP) | 35% out of 96 |
| Heatmap | 16% | |
| Channel image | 9% | |
| Parallel plot | (ERP) amplitudes | 50% out of 8 |
| Parallel coordinates | 50% |
plots2 <- c("../miniatures/1.png", "../miniatures/filler.png", "../miniatures/filler.png", "../miniatures/2.png", "../miniatures/filler.png", "../miniatures/filler.png", "../miniatures/3.png","../miniatures/filler.png", "../miniatures/filler.png", "../miniatures/4.png", "../miniatures/filler.png", "../miniatures/filler.png", "../miniatures/5.png", "../miniatures/filler.png", "../miniatures/filler.png", "../miniatures/6.png", "../miniatures/filler.png", "../miniatures/filler.png", "../miniatures/7.png", "../miniatures/filler.png", "../miniatures/filler.png", "../miniatures/8.png", "../miniatures/filler.png")

plotnames <- create_table(t) %>% data.frame() %>%
  mutate(names = str_to_sentence(names)) %>%
  mutate(names = str_replace(names, "Erp", "ERP")) %>%
  mutate(names = str_replace(names, "erp", "ERP")) %>% tibble::add_column(Plots = plots2, .before = "type") %>%
  dplyr::rename(`Plot types` = type,
         `Aggregated responses` = names,
         `Scores` =  score) %>% select(-n, -total, -p)

plotnames_pic <- plotnames %>% flextable() %>%
  merge_at(j= 1, i = 1:3) %>% merge_at(j= 1, i = 4:6) %>%
  merge_at(j= 1, i = 7:9) %>% merge_at(j= 1, i = 10:12) %>%
  merge_at(j= 1, i = 13:15) %>% merge_at(j= 1, i = 16:18) %>%
  merge_at(j= 1, i = 19:21) %>% merge_at(j= 1, i = 22:23) %>%

  merge_at(j= 2, i = 1:3) %>% merge_at(j= 2, i = 4:6) %>%
  merge_at(j= 2, i = 7:9) %>% merge_at(j= 2, i = 10:12) %>%
  merge_at(j= 2, i = 13:15) %>% merge_at(j= 2, i = 16:18) %>%
  merge_at(j= 2, i = 19:21) %>% merge_at(j= 2, i = 22:23)  %>%
  valign(j = 2, valign = "center", part = "all") %>%
  compose(j = 'Plots', value = as_paragraph(as_image(Plots, width = 1, height = 0.6))) %>%
   padding(padding = 1, part = "all") %>%
  autofit() %>% valign(valign = "top") %>%
  height_all(0.01, part = "all", unit = "cm") %>%
  surround(
    i = c(3, 6, 9, 12, 15, 18, 21),
    j = 1:4,
    border.bottom = fp_border(color = "gray", style = "dashed"),
    part = "body"
  ) %>%   font(fontname = "Lato", part="all") %>%
  hline_bottom(part = "body", border = fp_border(color = "white", width = 3))
plotnames_pic
Plots | Plot types | Aggregated responses | Scores |
|---|---|---|---|
| ERP plot | ERP (plot) | 39% out of 197 |
Averaged ERP (plot) | 19% | ||
ERP wave(form)s | 6% | ||
| Butterfly plot | Butterfly (plot) | 48% out of 159 |
Single/individual channel ERP (plot) | 17% | ||
Multi(channel/electrode) ERP (plot) | 14% | ||
| Topoplot | Topo(plot) | 40% out of 192 |
Topography (plot) | 39% | ||
Topomap | 7% | ||
| Topoplot | Topo(plot) over time(series/course) | 23% out of 189 |
Topography over time(series/course) | 22% | ||
Topo(plot) | 12% | ||
| ERP grid | ERP over channels | 15% out of 162 |
Multi(channel) plot | 14% | ||
Topographic ERP | 14% | ||
| ERP image | ERP image | 27% out of 114 |
Sorted ERP trials | 19% | ||
Trials | 11% | ||
| Channel image | Channel(s) (ERP) | 35% out of 96 |
Heatmap | 16% | ||
Channel image | 9% | ||
| Parallel plot | (ERP) amplitudes | 50% out of 8 |
Parallel coordinates | 50% |
#save_as_html(plotnames_pic, path = "Table 2.html")
#save_as_image(plotnames_pic, path = "Table 2.png")tab1 <- create_table(t) %>% data.frame() %>%
mutate(names = str_to_sentence(names)) %>%
mutate(names = str_replace(names, "Erp", "ERP")) %>%
mutate(names = str_replace(names, "erp", "ERP")) %>% tibble::add_column(Plots = plots2, .before = "type") %>%
dplyr::rename(`Plot types` = type,
`Aggregated responses` = names,
`Scores` = score) %>% select(-n, -total, -p) %>% gt() %>%
text_transform(
locations = cells_body(columns = Plots),
fn = function(x) {
lapply(x, function(x) {
html(paste(local_image(filename = x)))
})
}
) %>% opt_table_font(font = "Source Sans Pro") %>% tab_options(table_body.hlines.color = "transparent") %>%
tab_options(data_row.padding = px(0.1), table.font.size = 14, container.padding.x = 1) %>%
tab_style(
style = cell_borders(
sides = c("bottom"),
color = "gray",
weight = px(1.5),
style = "dotted"
),
locations = cells_body(rows = c(3, 6, 9, 12, 15, 18, 21)))
tab1 #%>% gtsave("Table 2.png")| Plots | Plot types | Aggregated responses | Scores |
|---|---|---|---|
|
ERP plot | ERP (plot) | 39% out of 197 |
 |
Averaged ERP (plot) | 19% | |
|
ERP wave(form)s | 6% | |
|
Butterfly plot | Butterfly (plot) | 48% out of 159 |
|
Single/individual channel ERP (plot) | 17% | |
|
Multi(channel/electrode) ERP (plot) | 14% | |
|
Topoplot | Topo(plot) | 40% out of 192 |
|
Topography (plot) | 39% | |
|
Topomap | 7% | |
|
Topoplot timeseries | Topo(plot) over time(series/course) | 23% out of 189 |
|
Topography over time(series/course) | 22% | |
|
Topo(plot) | 12% | |
|
ERP grid | ERP over channels | 15% out of 162 |
|
Multi(channel) plot | 14% | |
|
Topographic ERP | 14% | |
|
ERP image | ERP image | 27% out of 114 |
|
Sorted ERP trials | 19% | |
|
Trials | 11% | |
|
Channel image | Channel(s) (ERP) | 35% out of 96 |
|
Heatmap | 16% | |
|
Channel image | 9% | |
|
Parallel plot | (ERP) amplitudes | 50% out of 8 |
|
Parallel coordinates | 50% |
stat_preproc <- function(vec){
  #N = 70
  tmp <- vec %>% filter(!is.na(.)) %>%
    dplyr::rename(words = !!names(.)[1]) %>% mutate(words = tolower(words)) %>%
    mutate(words = ifelse(nchar(words) < 3, paste(words, "baddd"), words)) %>%
    mutate(check =
    ifelse(grepl("\\b(baddd|idea|sure|confus|aware|do not|know|why|good|remember|unsure|confusing|mess|unclear|ugly|don't|useless|nan|clear)\\b", words), "bad", "good"))
  return(tmp)
}

vec_named <- names(data[ , grepl( "How would you " , names(data))])
plot_names <- c("line", "butterfly", "topo", "topo_series", "erp_grid", "erp_img", "parallel", "channel_img")

na_table <- function(data, vec_named, plot_names){
    temp <- data.frame(plot_names)
    temp$n <- NA
    for (i in 1:8){
      n_part <-
        data[vec_named[i]] %>%  stat_preproc(.) %>% #View()
      filter(check != "bad") %>%
      dplyr::summarise(n = n())
      temp$n[i] <- n_part$n
    }
    return(temp)
}

num_named <- na_table(data, vec_named, plot_names)

familiar <-  data[61:68] %>% rename_at(vars(colnames(.)), ~ plot_names) %>%
  mutate_at(vars(plot_names), function(., na.rm = FALSE) (x = ifelse(.=="Yes", 1, 0))) %>%
  t() %>% rowSums(.) %>% data.frame(.) %>%  tibble::rownames_to_column(., "plot") %>%
  rename_at(vars(colnames(.)), ~ c("plots", "recognized"))

vec_plotted <- names(data[ , grepl( "Have you ever plotted " , names(data))])

do_vec <- function(vec_plotted, data, plot_names){
  t1 <- table(data[vec_plotted[1]])
  for (i in 2:length(vec_plotted)) {
    t <- table(data[vec_plotted[i]])
    t1 <- rbind(t1, t)
  }
  rownames(t1) <- plot_names
  return(t1)
}

tab <- do_vec(vec_plotted, data, plot_names) %>%  data.frame() %>% tibble::rownames_to_column(., "plots") %>%
  gather(., type, plotted, `N.A`:`Yes`, factor_key=TRUE) %>%
  filter(type == "Yes") %>% dplyr::select(-type)

named <- num_named %>% dplyr::rename(named = n, plots = plot_names)

mem_tab <-  familiar %>%
   rename_at(vars(colnames(.)), ~ c("plots", "recognized")) %>%
  left_join(., named)  %>% left_join(., tab)
mem_tab
plots recognized named plotted
1 line 199 196 187
2 butterfly 168 159 125
3 topo 192 192 175
4 topo_series 195 188 153
5 erp_grid 187 162 133
6 erp_img 133 114 70
7 parallel 11 9 5
8 channel_img 125 98 51vec <- names(data[ , grepl( ".*Which parts of*." , names(data))])
#which(names(data) %in% vec)word_preproc_tool_2 <- function(data, N, lim){
#lim = 10
tmp <- data %>% dplyr::select(N, N+1, N+2) %>% dplyr::rename(soft = !!names(.)[1], parts = !!names(.)[2], new_feature = !!names(.)[3]) %>%
filter(!is.na(soft)) %>%
mutate_at(vars(colnames(.)), funs(tolower(.))) %>%
mutate(soft = str_replace(soft, 'own', "custom"),
soft = str_replace(soft, '(matlab)', "matlab"),
soft = case_when(
str_detect(soft, 'brain vision') ~ "brain vision analyser",
#str_detect(soft, 'matlab|bar.m|boundedline') ~ "custom matlab",
str_detect(soft, 'mne') ~ "mne",
TRUE ~ as.character(soft)
),
parts = case_when(
str_detect(parts, 'none|n/a|nope|na|idk|nothing|sure|know|can\'t|don\'t|easy') ~ "-",
TRUE ~ as.character(parts)
),
new_feature = case_when(
str_detect(new_feature, 'none|n/a|nope|na|idk|nothing|sure|know|can\'t|don\'t') ~ "-",
TRUE ~ as.character(new_feature)
)) %>%
filter_at(vars(parts, new_feature), all_vars(!is.na(.))) %>% mutate(n = lengths(gregexpr("\\W+", soft)) + 1) %>%
filter(parts != "-" | new_feature != "-", n < lim) %>% dplyr::select(-4) %>% arrange(soft)
return(tmp)
}struggle1 <- word_preproc_tool_2(data, 71, 10)
separated_row <- separate_rows(struggle1[98, ], parts, sep = ",|\\.") %>% dplyr::select(soft, parts)
tmp <- struggle1 %>% filter( parts != "-") %>% dplyr::select(soft, parts) %>%
filter(!row_number() %in% c(2, 11, 40, 41, 69, 78, 83, 87, 89, 91)) %>%
separate_rows(parts, sep = "2\\)", convert = FALSE) %>%
separate_rows(parts, sep = "\\\r\\\n", convert = FALSE) %>% rbind(., separated_row) %>%
mutate(problems = case_when(
grepl("\\b(ci|se|sem|errorbar(s)?|sme|sd|uncertainty|error(s)?|confidence|variance|deviation(s)?|shading|shaded|bars|transparency|publication)\\b", parts) == TRUE ~ "uncertainty",
grepl("\\b(axes|lable(s)?|label(s)?|legend|ticks)\\b", parts) == TRUE ~ "customization",
grepl("\\b(proportion(s)?|scal(e|ing|es))\\b", parts) == TRUE ~ "scaling",
grepl("\\b(color(s)?|colour(s)?)\\b", parts) == TRUE ~ "color",
grepl("\\b(preprocessing|extracting|datatype)\\b", parts) == TRUE ~ "preprocessing",
grepl("\\b(syncronisation|organizing|groups)\\b", parts) == TRUE ~ "subplotting",
grepl("\\b(mean|significan(t|ce)|permutations|combine)\\b", parts) == TRUE ~ "statistics",
)) %>% filter(nchar(parts) != 0) %>% filter(!is.na(problems)) #%>% View()
n_rest <- mem_tab %>% filter(plots == "line") %>% select(plotted) - nrow(tmp)
tmp1 <- tmp %>% group_by(problems) %>%
dplyr::summarise(n = n()) %>%
rbind(c("no complains", as.numeric(n_rest$plotted))) %>%
mutate(n = as.numeric(n)) %>%
mutate(total = sum(n))
problem1 <- tmp1 %>% mutate(name = "ERP plot")
tmp1# A tibble: 8 × 3
problems n total
<chr> <dbl> <dbl>
1 color 4 187
2 customization 11 187
3 preprocessing 3 187
4 scaling 3 187
5 statistics 4 187
6 subplotting 3 187
7 uncertainty 63 187
8 no complains 96 187struggle2 <- word_preproc_tool_2(data, 82, 10)
#separated_row <- separate_rows(struggle1[98, ], parts, sep = ",|\\.") %>% dplyr::select(parts)
tmp <- struggle2 %>% filter( parts != "-") %>% dplyr::select(parts) %>%
filter(!row_number() %in% c(18, 31)) %>%
#separate_rows(parts, sep = "2\\)", convert = FALSE) %>%
#separate_rows(parts, sep = "\\\r\\\n", convert = FALSE) %>% rbind(., separated_row) %>%
mutate(problems = case_when(
grepl("\\b(ci|se|sem|errorbar(s)?|sme|sd|uncertainty|error(s)?|confidence|variance|deviation(s)?|shading|shaded|bars|transparency)\\b", parts) == TRUE ~ "uncertainty",
grepl("\\b(publication|ax(is|es)?|lable(s)?|label(s)?|legend|ticks|neg)\\b", parts) == TRUE ~ "customization",
grepl("\\b(color(s|ing)?|colour(s)?)\\b", parts) == TRUE ~ "color",
grepl("\\b(proportion(s)?|scal(e|ing|es))\\b", parts) == TRUE ~ "scaling",
grepl("\\btopo\\w*", parts) == TRUE ~ "adding topography",
grepl("\\b(channel(s)?|electrodes(s)?|interpretable|read|remembering)\\b", parts) == TRUE ~ "channel selection"
)) %>% filter(nchar(parts) != 0) %>% filter(!is.na(problems)) #%>% View()
n_rest <- mem_tab %>% filter(plots == "butterfly") %>% select(plotted) - nrow(tmp)
tmp2 <- tmp %>% group_by(problems) %>%
dplyr::summarise(n = n()) %>%
rbind(c("no complains", as.numeric(n_rest$plotted))) %>%
mutate(n = as.numeric(n)) %>%
mutate(total = sum(n))
problem2 <- tmp2 %>% mutate(name = "Butterfly plot")
tmp2 # A tibble: 6 × 3
problems n total
<chr> <dbl> <dbl>
1 adding topography 5 125
2 channel selection 11 125
3 color 14 125
4 customization 4 125
5 uncertainty 1 125
6 no complains 90 125struggle3 <- word_preproc_tool_2(data, 87, 10)
#separated_row <- separate_rows(struggle1[98, ], parts, sep = ",|\\.") %>% dplyr::select(parts)
tmp <- struggle3 %>% filter( parts != "-") %>% dplyr::select(parts) %>%
filter(!row_number() %in% c(5, 7, 16, 18, 43, 50)) %>%
separate_rows(parts, sep = ";", convert = FALSE) %>% filter(nchar(parts) != 0) %>%
filter(!row_number() %in% c(59)) %>%
#separate_rows(parts, sep = "\\\r\\\n", convert = FALSE) %>% rbind(., separated_row) %>%
mutate(problems = case_when(
grepl("\\b(head|headshape|montage|topographies)\\b", parts) == TRUE ~ "head shape and montage",
grepl("\\b(time|threshold)\\b", parts) == TRUE ~ "time range selection",
grepl("\\b(ci|se|sem|errorbar(s)?|sme|sd|uncertainty|error(s)?|confidence|variance|deviation(s)?|shading|shaded|bars|transparency)\\b", parts) == TRUE ~ "uncertainty",
grepl("\\b(scal(e|ing|es)|limits|proportion(s)?)\\b", parts) == TRUE ~ "scaling",
grepl("\\b(interpolat(e|ion)?|edges)\\b", parts) == TRUE ~ "interpolation",
grepl("\\b(color(s|ing|bar|map)?|colour(s)?)\\b", parts) == TRUE ~ "color",
grepl("\\b(channel(s)?|electrode(s)?|sensors|elec)\\b", parts) == TRUE ~ "channel selection",
grepl("\\b(publication|ax(is|es)?|lable(s)?|label(s|ing)?|legend|ticks|features|layout)\\b", parts) == TRUE ~ "customization",
grepl("\\b(mean|significan(t|ce)|permutations|p-value(s)?|smoothing|statistical|stats)\\b", parts) == TRUE ~ "statistics",
)) %>%
filter(nchar(parts) != 0) %>% filter(!is.na(problems)) #%>% View()
n_rest <- mem_tab %>% filter(plots == "topo") %>% select(plotted) - nrow(tmp)
tmp3 <- tmp %>% group_by(problems) %>%
dplyr::summarise(n = n()) %>%
rbind(c("no complains", as.numeric(n_rest$plotted))) %>%
mutate(n = as.numeric(n)) %>%
mutate(total = sum(n))
problem3 <- tmp3 %>% mutate(name = "Topoplot")
tmp3# A tibble: 9 × 3
problems n total
<chr> <dbl> <dbl>
1 channel selection 15 175
2 color 9 175
3 customization 4 175
4 head shape and montage 10 175
5 interpolation 5 175
6 scaling 9 175
7 statistics 3 175
8 time range selection 5 175
9 no complains 115 175struggle4 <- word_preproc_tool_2(data, 92, 10)
#separated_row <- separate_rows(struggle1[98, ], parts, sep = ",|\\.") %>% dplyr::select(parts)
tmp <- struggle4 %>% filter( parts != "-") %>% dplyr::select(parts) %>%
filter(!grepl("\\b(no|okay|certain|see|same as|\"\"|reaching)\\b", parts)) %>% #View()
filter(!row_number() %in% c(17, 51, 12 )) %>%
separate_rows(parts, sep = ";", convert = FALSE) %>%
#filter(!row_number() %in% c(59)) %>%
#separate_rows(parts, sep = "\\\r\\\n", convert = FALSE) %>% rbind(., separated_row) %>%
mutate(problems = case_when(
grepl("\\b(head|headshape|montage|topographies|topoplots|shape)\\b", parts) == TRUE ~ "head shape and montage",
grepl("\\b(time(s|course|points)?|threshold)\\b", parts) == TRUE ~ "time specification",
grepl("\\b(channel(s)?|electrode(s)?|sensors|elec)\\b", parts) == TRUE ~ "channel selection",
grepl("\\b(color(s|ing|bar|map|scale)?|colour(s)?|color)\\b", parts) == TRUE ~ "color",
grepl("\\b(ax(is|es)?|lable(s)?|label(s|ing)?|features|markers|layout|specifications|publication|handle)\\b", parts) == TRUE ~ "customization",
grepl("\\b(visible|subplots|size(s)?|resizing|arrange|scal(e|ing|es)|references|limits)\\b", parts) == TRUE ~ "scaling",
grepl("\\b(mean|significan(t|ce)|permutations|smoothing|statistical|stats|t-stat)\\b", parts) == TRUE ~ "statistics",
grepl("\\b(interpolat(e|ion)?|edges)\\b", parts) == TRUE ~ "interpolation",
TRUE ~ '_other'
)) %>% filter(nchar(parts) != 0) %>% filter(!is.na(problems)) #%>% View()
n_rest <- mem_tab %>% filter(plots == "topo_series") %>% select(plotted) - nrow(tmp)
tmp4 <- tmp %>% group_by(problems) %>%
dplyr::summarise(n = n()) %>%
rbind(c("no complains", as.numeric(n_rest$plotted))) %>%
mutate(n = as.numeric(n)) %>%
mutate(total = sum(n))
problem4 <- tmp4 %>% mutate(name = "Topoplot timeseries")
tmp4# A tibble: 8 × 3
problems n total
<chr> <dbl> <dbl>
1 channel selection 3 153
2 color 7 153
3 customization 6 153
4 head shape and montage 3 153
5 scaling 6 153
6 statistics 1 153
7 time specification 26 153
8 no complains 101 153struggle5 <- word_preproc_tool_2(data, 99, 10)
#separated_row <- separate_rows(struggle1[98, ], parts, sep = ",|\\.") %>% dplyr::select(parts)
tmp <- struggle5 %>% filter( parts != "-") %>% dplyr::select(parts) %>% #View()
filter(!grepl("\\b(_|reaching)\\b", parts)) %>%
filter(!row_number() %in% c(33 )) %>%
separate_rows(parts, sep = ";", convert = FALSE) %>% #View()
#filter(!row_number() %in% c(59)) %>%
#separate_rows(parts, sep = "\\\r\\\n", convert = FALSE) %>% rbind(., separated_row) %>%
mutate(problems = case_when(
grepl("\\b(selecting|marking|spotting)\\b", parts) == TRUE ~ "channel selection",
grepl("\\b(legible|readable|visible|small|shape|montage|subplots|size(s)?|larger|dimensions|channel(s)?|electrode(s)?|sensors)|scal(e|ing|es)|references\\b", parts) == TRUE ~ "legibility and scaling",
grepl("\\b(ci|se|sem|errorbar(s)?|sme|sd|uncertainty|error(s)?|confidence|variance|deviation(s)?|shading|shaded|bars|transparency)\\b", parts) == TRUE ~ "uncertainty",
grepl("\\b(color(s|ing|bar|map)?|colour(s)?)\\b", parts) == TRUE ~ "color",
grepl("\\b(publication|quality|ax(is|es)?|lable(s)?|label(s|ing)?|legend|ticks|edit|features|markers|layout)\\b", parts) == TRUE ~ "customization",
grepl("\\b(preprocessing|extracting|masks)\\b", parts) == TRUE ~ "preprocessing",
TRUE ~ '_other'
)) %>% filter(nchar(parts) != 0) %>% filter(!is.na(problems)) #%>% View()
#filter(problems =="legibility and scaling") %>%
n_rest <- mem_tab %>% filter(plots == "erp_grid") %>% select(plotted) - nrow(tmp)
tmp5 <- tmp %>% group_by(problems) %>%
dplyr::summarise(n = n()) %>%
rbind(c("no complains", as.numeric(n_rest$plotted))) %>%
mutate(n = as.numeric(n)) %>%
mutate(total = sum(n))
problem5 <- tmp5 %>% mutate(name = "ERP grid")
tmp5# A tibble: 7 × 3
problems n total
<chr> <dbl> <dbl>
1 channel selection 3 133
2 color 1 133
3 customization 8 133
4 legibility and scaling 33 133
5 preprocessing 2 133
6 uncertainty 2 133
7 no complains 84 133struggle6 <- word_preproc_tool_2(data, 104, 10)
#separated_row <- separate_rows(struggle1[98, ], parts, sep = ",|\\.") %>% dplyr::select(parts)
tmp <- struggle6 %>% filter( parts != "-") %>% dplyr::select(parts) %>%
filter(!grepl("\\b(x|ok|no)\\b", parts)) %>%
# filter(!row_number() %in% c(33 )) %>%
separate_rows(parts, sep = ";", convert = FALSE) %>% #View()
#filter(!row_number() %in% c(59)) %>%
#separate_rows(parts, sep = "\\\r\\\n", convert = FALSE) %>% rbind(., separated_row) %>%
mutate(problems = case_when(
grepl("\\b(axes|paper)\\b", parts) == TRUE ~ "customization",
grepl("\\b(preprocessing|making sense|correspondance)\\b", parts) == TRUE ~ "preprocessing",
grepl("\\b(sort(ing)?|max|correspondance)\\b", parts) == TRUE ~ "sorting",
grepl("\\b(smoothing)\\b", parts) == TRUE ~ "smoothing",
grepl("\\b(epochs|time)\\b", parts) == TRUE ~ "time specification",
grepl("\\b(colo(r|ur)|paper)\\b", parts) == TRUE ~ "color",
TRUE ~ '_other'
)) %>% filter(nchar(parts) != 0) %>% filter(!is.na(problems)) #%>% View() #%>% filter(problems =="defining epochs")
n_rest <- mem_tab %>% filter(plots == "erp_img") %>% select(plotted) - nrow(tmp)
tmp6 <- tmp %>% group_by(problems) %>%
dplyr::summarise(n = n()) %>%
rbind(c("no complains", as.numeric(n_rest$plotted))) %>%
mutate(n = as.numeric(n)) %>%
mutate(total = sum(n))
problem6 <- tmp6 %>% mutate(name = "ERP image")
tmp6# A tibble: 7 × 3
problems n total
<chr> <dbl> <dbl>
1 color 2 70
2 customization 2 70
3 preprocessing 3 70
4 smoothing 3 70
5 sorting 5 70
6 time specification 2 70
7 no complains 53 70struggle8 <- word_preproc_tool_2(data, 114, 10)
#separated_row <- separate_rows(struggle1[98, ], parts, sep = ",|\\.") %>% dplyr::select(parts)
tmp <- struggle8 %>% filter( parts != "-") %>% dplyr::select(parts) %>%
filter(!grepl("\\b(n|x|ok|dont)\\b", parts)) %>% #View()
# filter(!row_number() %in% c(33 )) %>%
#separate_rows(parts, sep = ";", convert = FALSE) %>% #View()
#filter(!row_number() %in% c(59)) %>%
#separate_rows(parts, sep = "\\\r\\\n", convert = FALSE) %>% rbind(., separated_row) %>%
mutate(problems = case_when(
grepl("\\b(sort(ing)?|order(ing)?|organisation)\\b", parts) == TRUE ~ "sorting",
grepl("\\b(smoothing)\\b", parts) == TRUE ~ "smoothing",
grepl("\\b(scale|visibility|visability|interpreting|range)\\b", parts) == TRUE ~ "legibility and scaling",
grepl("\\b(color(bar)?|paper)\\b", parts) == TRUE ~ "color",
TRUE ~ '_other'
)) %>% filter(nchar(parts) != 0) %>% filter(!is.na(problems)) #%>% View()# %>% filter(problems =="_other")
n_rest <- mem_tab %>% filter(plots == "channel_img") %>% select(plotted) - nrow(tmp)
tmp8 <- tmp %>% group_by(problems) %>%
dplyr::summarise(n = n()) %>%
rbind(c("no complains", as.numeric(n_rest$plotted))) %>%
mutate(n = as.numeric(n)) %>%
mutate(total = sum(n))
problem8 <- tmp8 %>% mutate(name = "Channel image")
tmp8# A tibble: 5 × 3
problems n total
<chr> <dbl> <dbl>
1 color 2 51
2 legibility and scaling 4 51
3 smoothing 1 51
4 sorting 7 51
5 no complains 37 51write.xlsx(data.frame(problem1) %>%
rename_at(vars(colnames(.)), ~ c("Main problems", "Scores", "Total", "Plot names")), "../data/aggregated_problems.xlsx", sheetName
="ERP plot", row.names=FALSE)
write.xlsx(problem2 %>% data.frame(.) %>%
rename_at(vars(colnames(.)), ~ c("Main problems", "Scores", "Total", "Plot names")), "../data/aggregated_problems.xlsx", append=TRUE, sheetName ="Butterfly plot", row.names=FALSE)
write.xlsx(problem3 %>% data.frame(.) %>%
rename_at(vars(colnames(.)), ~ c("Main problems", "Scores", "Total", "Plot names")), "../data/aggregated_problems.xlsx", append=TRUE, sheetName ="Topoplot", row.names=FALSE)
write.xlsx(problem4 %>% data.frame(.) %>%
rename_at(vars(colnames(.)), ~ c("Main problems", "Scores", "Total", "Plot names")), "../data/aggregated_problems.xlsx", append=TRUE, sheetName ="Topoplot timeseries", row.names=FALSE)
write.xlsx(problem5 %>% data.frame(.) %>%
rename_at(vars(colnames(.)), ~ c("Main problems", "Scores", "Total", "Plot names")), "../data/aggregated_problems.xlsx", append=TRUE, sheetName ="ERP grid", row.names=FALSE)
write.xlsx(problem6 %>% data.frame(.) %>%
rename_at(vars(colnames(.)), ~ c("Main problems", "Scores", "Total", "Plot names")), "../data/aggregated_problems.xlsx", append=TRUE, sheetName ="ERP image", row.names=FALSE)
write.xlsx(problem8 %>% data.frame(.) %>%
rename_at(vars(colnames(.)), ~ c("Main problems", "Scores", "Total", "Plot names")), "../data/aggregated_problems.xlsx", append=TRUE, sheetName ="Channel image", row.names=FALSE)prob_comb <-
rbind(problem1, problem2, problem3, problem4, problem5, problem6, problem8) %>%
group_by(name) %>% mutate(index = match(name, unique(name))) %>% filter(problems != "no complains") %>%
arrange(desc(n)) %>% slice(1:3) %>%
arrange(index) %>% dplyr::select(name, problems, n, total) %>%
mutate(name = str_to_sentence(name)) %>%
mutate(name = str_replace(name, "Erp", "ERP")) %>%
mutate(name = str_replace(name, "erp", "ERP")) %>%
group_by(name) %>%
dplyr::mutate(groupRow = 1:n()) %>%
ungroup() %>%
mutate(p = round(as.numeric(n)/as.numeric(total), 2) * 100) %>%
dplyr::group_by(name) %>% mutate(mx = max(p)) %>%
arrange(desc(mx), desc(p)) %>%
mutate(score = paste(p, total, sep = "% out of ")) %>%
dplyr::mutate(name = ifelse(groupRow == 1, as.character(name), "")) %>%
dplyr::mutate(score = ifelse(groupRow == 1, as.character(score), paste(p, "%", sep = ""))) %>%
select(-c(groupRow, n, total, p, mx))
prob_comb# A tibble: 21 × 3
# Groups: name [8]
name problems score
<chr> <chr> <chr>
1 "ERP plot" uncertainty 34% out of 187
2 "" customization 6%
3 "" color 2%
4 "ERP grid" legibility and scaling 25% out of 133
5 "" customization 6%
6 "" channel selection 2%
7 "Topoplot timeseries" time specification 17% out of 153
8 "" color 5%
9 "" customization 4%
10 "Channel image" sorting 14% out of 51
# ℹ 11 more rowsplots3 <- c("../miniatures/1.png", "../miniatures/filler.png", "../miniatures/filler.png", "../miniatures/5.png", "../miniatures/filler.png", "../miniatures/filler.png", "../miniatures/4.png","../miniatures/filler.png", "../miniatures/filler.png", "../miniatures/7.png", "../miniatures/filler.png", "../miniatures/filler.png", "../miniatures/2.png", "../miniatures/filler.png", "../miniatures/filler.png", "../miniatures/3.png", "../miniatures/filler.png", "../miniatures/filler.png", "../miniatures/6.png", "../miniatures/filler.png", "../miniatures/filler.png")
probs <- prob_comb %>% tibble::add_column(Plots = plots3, .before = "name") %>% dplyr::rename(`Plot name` = name,
`The main problem` = problems,
`Scores` = score) %>% ungroup()
probs_pic <- probs %>% flextable() %>%
merge_at(j= 1, i = 1:3) %>% merge_at(j= 1, i = 4:6) %>%
merge_at(j= 1, i = 7:9) %>% merge_at(j= 1, i = 10:12) %>%
merge_at(j= 1, i = 13:15) %>% merge_at(j= 1, i = 16:18) %>%
merge_at(j= 1, i = 19:21) %>%
merge_at(j= 2, i = 1:3) %>% merge_at(j= 2, i = 4:6) %>%
merge_at(j= 2, i = 7:9) %>% merge_at(j= 2, i = 10:12) %>%
merge_at(j= 2, i = 13:15) %>% merge_at(j= 2, i = 16:18) %>%
merge_at(j= 2, i = 19:21) %>%
padding(padding = 1, part = "all") %>%
valign(j = 2, valign = "center", part = "all") %>%
compose(j = 'Plots', value = as_paragraph(as_image(Plots, width = 1, height = 0.6))) %>%
autofit() %>%
height_all(0.01, part = "all", unit = "cm") %>%
surround(
i = c(3, 6, 9, 12, 15, 18, 21),
j = 1:4,
border.bottom = fp_border(color = "gray", style = "dashed"),
part = "body"
) %>%
hline_bottom(part = "body", border = fp_border(color = "white", width = 3)) %>%
font(fontname = "Lato", part="all")
probs_pic Plots | Plot name | The main problem | Scores |
|---|---|---|---|
| ERP plot | uncertainty | 34% out of 187 |
customization | 6% | ||
color | 2% | ||
| ERP grid | legibility and scaling | 25% out of 133 |
customization | 6% | ||
channel selection | 2% | ||
| Topoplot timeseries | time specification | 17% out of 153 |
color | 5% | ||
customization | 4% | ||
| Channel image | sorting | 14% out of 51 |
legibility and scaling | 8% | ||
color | 4% | ||
| Butterfly plot | color | 11% out of 125 |
channel selection | 9% | ||
adding topography | 4% | ||
| Topoplot | channel selection | 9% out of 175 |
head shape and montage | 6% | ||
color | 5% | ||
| ERP image | sorting | 7% out of 70 |
preprocessing | 4% | ||
smoothing | 4% |
#save_as_image(probs_pic, path = "Table 3.pdf")
#save_as_html(probs_pic, path = "Table 3.html")rbind(problem1, problem2, problem3, problem4, problem5, problem6, problem8) %>%
group_by(name) %>% mutate(index = match(name, unique(name))) %>% filter(problems == "no complains") %>%
mutate(percent1 = 100 - (round(n / total, 2) * 100)) %>%
ggplot(., aes(y = reorder(name, percent1), x = percent1)) +
geom_col(fill ="lightblue1", colour ="dodgerblue3") +
geom_text(aes(label = paste0(percent1, "%"), y = name, x = percent1),
position = position_stack(vjust = 0.5), color = "black") +
labs(x = "Percent of complains", y = "") +
theme_classic() +
theme(axis.text = element_text(size = 12), legend.position = "none")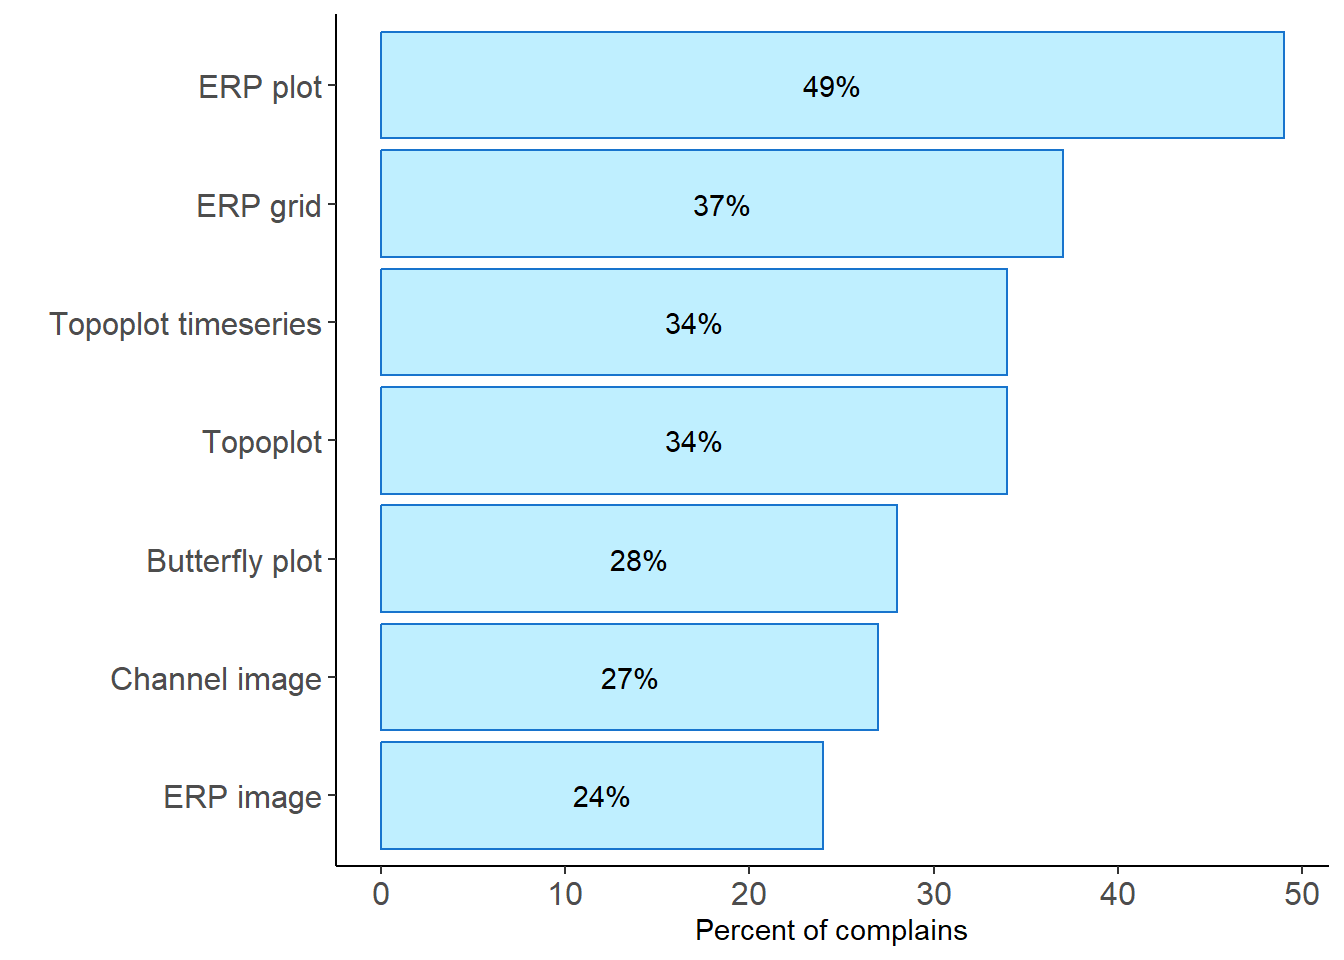
tmp <- struggle1 %>% filter( new_feature != "-") %>% dplyr::select(new_feature) %>%
  filter(!grepl("\\b(\\.|\\/|see)\\b", new_feature)) %>%
  filter(!row_number() %in% c(13, 18, 20  ))  %>%
  separate_rows(new_feature, sep = ";", convert = FALSE) %>%
#filter(!row_number() %in% c(59))  %>%
  separate_rows(new_feature, sep = "\\\r\\\n", convert = FALSE) %>%
  mutate(group = case_when(
    grepl("\\bsignif\\w*", new_feature) == TRUE ~ "adding significance",
    grepl("\\bstat\\w*", new_feature) == TRUE ~ "adding statistics",
    grepl("\\btopo\\w*", new_feature) == TRUE ~ "adding topoplot",
    grepl("\\b(custom\\w*|details|annotations|font|labels|color|colours|thicker)", new_feature) == TRUE ~ "customization (color, labels)",
    grepl("\\b(electrode|click|control|interact\\w*|gui|select\\w*)", new_feature) == TRUE ~ "interactivity and channel selection",
    grepl("\\b(highlight|shadow|window)", new_feature) == TRUE ~ "area highlighting",
    grepl("\\b(ci|ribbons|se|ses|sem|errorbar(s)?|sme|sd|uncertainty|error(s)?|confidence|variance|deviation(s)?|shading|shaded|bars|transparency)\\b", new_feature) == TRUE ~ "uncertainty",

      TRUE ~ '_other'
      )) %>% filter(nchar(new_feature) != 0) #%>% View()

#n_rest <- mem_tab[2, 3] - nrow(tmp)

tmp1 <- tmp %>% group_by(group) %>%
      dplyr::summarise(n = n()) %>%
     # rbind(c("no complains", as.numeric(n_rest))) %>%
      mutate(n = as.numeric(n)) %>%
      mutate(percent = round(n / sum(n), 3) * 100, percent1 = round(n / sum(n), 2) * 100)


tmp1 %>%
  arrange(desc(n)) %>%
  kable(escape = F, booktabs = T) %>% kable_styling("striped", position = "center",) %>%
kable_classic(full_width = F, html_font = "Arial")| group | n | percent | percent1 |
|---|---|---|---|
| uncertainty | 18 | 25.7 | 26 |
| _other | 14 | 20.0 | 20 |
| customization (color, labels) | 11 | 15.7 | 16 |
| interactivity and channel selection | 9 | 12.9 | 13 |
| adding significance | 6 | 8.6 | 9 |
| adding statistics | 6 | 8.6 | 9 |
| area highlighting | 4 | 5.7 | 6 |
| adding topoplot | 2 | 2.9 | 3 |
 # words = ifelse(nchar(words)==0, NA, words),
#write.xlsx(tmp, "data/struggles.xlsx", sheetName = "line plot", col.names = TRUE, row.names = TRUE, append = FALSE)

# problems: n of problems is higher than number of rows tmp <- struggle2 %>% filter( new_feature != "-") %>% dplyr::select(new_feature) %>% #View()
filter(!grepl("\\b(see|not|useful)\\b", new_feature)) %>%
#filter(!row_number() %in% c(13, 18, 20 )) %>%
#separate_rows(new_feature, sep = ";", convert = FALSE) %>%
#filter(!row_number() %in% c(59)) %>%
separate_rows(new_feature, sep = "\\\r\\\n", convert = FALSE) %>%
mutate(group = case_when(
grepl("\\bsignif\\w*", new_feature) == TRUE ~ "adding significance",
grepl("\\b(stat\\w*|average|mean)", new_feature) == TRUE ~ "adding statistics",
grepl("\\btopo\\w*", new_feature) == TRUE ~ "adding topoplot",
grepl("\\b(custom\\w*|details|annotations|opacity|font|labels|color|colour(s)?|thicker)", new_feature) == TRUE ~ "customization (color, labels)",
grepl("\\b(manipulating|highlight|graying|click|control|interact\\w*|gui|select\\w*)", new_feature) == TRUE ~ "interactivity and channel selection",
grepl("\\b(ci|ribbons|se|ses|sem|errorbar(s)?|sme|sd|uncertainty|error(s)?|confidence|variance|deviation(s)?|shading|shaded|bars|transparency)\\b", new_feature) == TRUE ~ "uncertainty",
TRUE ~ '_other'
)) %>% filter(nchar(new_feature) != 0) #%>% View()
tmp1 <- tmp %>% group_by(group) %>%
dplyr::summarise(n = n()) %>%
# rbind(c("no complains", as.numeric(n_rest))) %>%
mutate(n = as.numeric(n)) %>%
mutate(percent = round(n / sum(n), 3) * 100, percent1 = round(n / sum(n), 2) * 100)
tmp1 %>%
arrange(desc(n)) %>%
kable(escape = F, booktabs = T) %>% kable_styling("striped", position = "center",) %>%
kable_classic(full_width = F, html_font = "Arial")| group | n | percent | percent1 |
|---|---|---|---|
| interactivity and channel selection | 16 | 35.6 | 36 |
| customization (color, labels) | 11 | 24.4 | 24 |
| adding topoplot | 9 | 20.0 | 20 |
| _other | 4 | 8.9 | 9 |
| adding statistics | 4 | 8.9 | 9 |
| uncertainty | 1 | 2.2 | 2 |
tmp <- struggle3 %>% filter( new_feature != "-") %>% dplyr::select(new_feature) %>%
  filter(!grepl("\\b(no|\\/|above|good|balanced)\\b", new_feature)) %>%  #View()
  #filter(!row_number() %in% c(13, 18, 20  ))  %>%
  #separate_rows(new_feature, sep = ";", convert = FALSE) %>%
#filter(!row_number() %in% c(59))  %>%
  separate_rows(new_feature, sep = "\\\r\\\n", convert = FALSE) %>%
  mutate(group = case_when(
    grepl("\\bsignif\\w*", new_feature) == TRUE ~ "adding significance",
    grepl("\\b(3d)\\b", new_feature) == TRUE ~ "3d",
    grepl("\\b(stat\\w*|average|mean)\\b", new_feature) == TRUE ~ "adding statistics",
    grepl("\\b(interpolat\\w*|extrapolat\\w*)\\b", new_feature) == TRUE ~ "interpolation and extrapolation",
    grepl("\\btopo\\w*", new_feature) == TRUE ~ "adding topoplot",
    grepl("\\b(custom\\w*|details|annotations|opacity|font|labels|color(s|map|maps|bar)?|colour(s)?|thicker)\\b", new_feature) == TRUE ~ "customization (color, labels)",
    grepl("\\b(anomatiom|slider|scrolling|gif|manipulating|hightlight|highlight|graying|click|control|interact\\w*|gui|select\\w*)", new_feature) == TRUE ~ "interactivity and channel selection",
    grepl("\\b(ci|ribbons|se|ses|sem|errorbar(s)?|sme|sd|uncertainty|error(s)?|confidence|variance|deviation(s)?|shading|shaded|bars|transparency)\\b", new_feature) == TRUE ~ "uncertainty",
     grepl("\\b(shape(s)?|circle|head)\\b", new_feature) == TRUE ~ "head shape",
      TRUE ~ '_other'
      )) %>% filter(nchar(new_feature) != 0)# %>% View()


tmp1 <- tmp %>% group_by(group) %>%
      dplyr::summarise(n = n()) %>%
     # rbind(c("no complains", as.numeric(n_rest))) %>%
      mutate(n = as.numeric(n)) %>%
      mutate(percent = round(n / sum(n), 3) * 100, percent1 = round(n / sum(n), 2) * 100)


tmp1 %>%
  arrange(desc(n)) %>%
  kable(escape = F, booktabs = T) %>% kable_styling("striped", position = "center",) %>%
kable_classic(full_width = F, html_font = "Arial")| group | n | percent | percent1 |
|---|---|---|---|
| customization (color, labels) | 17 | 24.6 | 25 |
| _other | 14 | 20.3 | 20 |
| interactivity and channel selection | 14 | 20.3 | 20 |
| 3d | 5 | 7.2 | 7 |
| head shape | 5 | 7.2 | 7 |
| interpolation and extrapolation | 5 | 7.2 | 7 |
| adding topoplot | 4 | 5.8 | 6 |
| adding significance | 3 | 4.3 | 4 |
| adding statistics | 2 | 2.9 | 3 |
fordev <- gdata::combine(struggle1, struggle2, struggle3, struggle4, struggle5, struggle6, struggle8)

fordev1 <- fordev %>%
  mutate(source = case_when(
    grepl("struggle1", source) == TRUE ~ "ERP plot",
    grepl("struggle2", source) == TRUE ~ "Butterfly plot",
    grepl("struggle3", source) == TRUE ~ "Topoplot",
    grepl("struggle4", source) == TRUE ~ "Topoplot series",
    grepl("struggle5", source) == TRUE ~ "ERP grid",
    grepl("struggle6", source) == TRUE ~ "ERP image",
    grepl("struggle8", source) == TRUE ~ "Channel image")) %>%
  dplyr::rename(struggles = parts, plot_type = source) %>% filter(nchar(soft) != 1) %>%
  mutate(struggles = ifelse(nchar(struggles) < 3, "-", struggles)) %>%
  mutate(struggles = str_replace_all(struggles, "it was ok", "-")) %>%
  mutate(new_feature = str_replace_all(new_feature, "it was ok", "-")) %>%
  mutate(new_feature = ifelse(nchar(new_feature) < 3, "-", new_feature))  %>%
  filter(!(new_feature == "-" & struggles == "-")) %>% filter(soft !="i don't remember") %>% filter(soft !="see comments for topoplot")
#%>% distinct(soft) %>% View()

fordev2 <-
  fordev1 %>% mutate(soft = case_when(
    grepl("matlab", soft) & grepl("custom", soft) & !grepl("(fieldtrip|eeglab|ggplot|erplab)", soft) == TRUE ~ "custom matlab",
    grepl("matlab", soft) & !grepl("(fieldtrip|eeglab|ggplot|erplab|python)", soft) == TRUE ~ "custom matlab",
    grepl("matplotlib", soft) & !grepl("(fieldtrip|eeglab|ggplot|erplab|python)", soft) == TRUE ~ "custom matplotlib",
    grepl("matplotlib", soft) & grepl("custom", soft) & !grepl("(fieldtrip|eeglab|ggplot|erplab)", soft) == TRUE ~ "custom matplotlib",
    grepl("ggplot", soft) & grepl("custom", soft) & !grepl("(fieldtrip|eeglab|erplab|plotly)", soft) == TRUE ~ "custom ggplot",
    grepl("ggplot", soft) & !grepl("(fieldtrip|eeglab|erplab|plotly)", soft) == TRUE ~ "custom ggplot",
    grepl("eeglab", soft) & grepl("custom", soft) & !grepl("(fieldtrip|ggplot|erplab)", soft) == TRUE ~ "custom eeglab",
    grepl("fieldteip|fieldtrip's ft_topoplot", soft)  == TRUE ~ "fieldtrip",
    grepl("eegalb|eeglan|eeglab gui|eeglab \\(i think\\)|eeglab, matlab plot", soft)  == TRUE ~ "eeglab",
    grepl("fieldtrip, matlab|fieldtrip", soft)  == TRUE ~ "fieldtrip, custom matlab",
    grepl("fieldtrip, matlab custom code", soft)  == TRUE ~ "fieldtrip, custom matlab",
    grepl("fieldtrip, matlab custom code)", soft)  == TRUE ~ "fieldtrip, custom matlab",

      TRUE ~ soft
)) %>% mutate(soft = str_replace_all(soft, " or", ",")) %>%
    mutate(soft = str_replace_all(soft, " and", ",")) %>%
    mutate(soft = str_replace_all(soft, ";", ",")) %>%
    mutate(soft = str_replace_all(soft, " \\+", ",")) %>%
    mutate(soft = str_replace(soft, "\\+", ", ")) %>%
    mutate(soft = str_replace_all(soft, "\\/", ", ")) %>%
    mutate(soft = str_replace_all(soft, " &", ", ")) %>%
    mutate(soft = str_replace_all(soft, "cant remember maybe ", "")) %>%
    mutate(soft = str_replace_all(soft, "cusom script, cartool back in the days.", "custom, cartool")) %>%
    mutate(soft = str_replace_all(soft, "brainstorm\\?", "brainstorm")) %>%
    mutate(soft = str_replace_all(soft, "script(s)?", "")) %>%
    mutate(soft = str_replace_all(soft, ",, code from mike cohen's book", "")) %>%
    mutate(soft = str_replace_all(soft, " for sanity checks", "")) %>%
    mutate(soft = str_replace_all(soft, " for sanity check, publication", "")) %>%
    mutate(soft = str_replace_all(soft, ', matlab "plot" function', "")) %>%
    mutate(soft = str_replace_all(soft, " with a few modifications of topoplot.m", "")) %>%
    mutate(soft = str_replace_all(soft, " ing", "")) %>%
    mutate(soft = str_replace_all(soft, "eeglab \\(topoplot\\), fieldtrip \\(ft_topoploter\\), github.com, widmann, sphspline", "eeglab, fieldtrip")) %>%
    mutate(soft = str_replace_all(soft, "fieldtrip ft_topoplotxxx functions\r\ncustom matlab code to modify", "fieldtrip, custom matlab")) %>%
    mutate(soft = str_replace_all(soft, "\r\n", ", ")) %>%
    mutate(soft = str_replace_all(soft, "spm12", "spm")) %>%
  select(soft, plot_type, struggles, new_feature) %>%
  rename_at(vars(colnames(.)), ~ c("Tools", "Plot type", "Struggles", "Proposed features"))

    # distinct(soft)  %>%
# View()eeglab <- fordev2 %>% filter(grepl("eeglab", Tools)) %>% write.csv("../feedback/eeglab.csv")
fieldtrip <- fordev2 %>% filter(grepl("fieldtrip", Tools)) %>% write.csv("../feedback/fieldtrip.csv")
mne <- fordev2 %>% filter(grepl("mne", Tools)) %>% write.csv("../feedback/mne.csv")
erplab <- fordev2 %>% filter(grepl("erplab", Tools)) %>% write.csv("../feedback/erplab.csv")
BVA <- fordev2 %>% filter(grepl("brain vision analyser", Tools)) %>% write.csv("../feedback/BVA.csv")
brainstorm <- fordev2 %>% filter(grepl("brainstorm", Tools)) %>% write.csv("../feedback/brainstorm.csv")
#spm <- fordev2 %>% filter(grepl("spm", Tools))
#besa <- fordev2 %>% filter(grepl("besa", Tools))
#cartool <- fordev2 %>% filter(grepl("cartool", Tools))
#unfold <- fordev2 %>% filter(grepl("unfold", Tools))feed <- data[120] %>% dplyr::rename(feedback = !!names(.)[1]) %>%
filter(!is.na(feedback), feedback != "-") #%>% View()
feed %>%
filter(!row_number() %in% c(3, 4, 14, 17, 32, 37, 41, 59)) %>% # just appreciation
write.csv("../feedback/general_feedback.csv")